The International Congress of Yoga and Eastern and Western Alternative Therapies, now in its 7th year, takes place from 20-26 June 🔗.
This Congress is pompously called "international" but, in fact, is sustained by the so-called International Federation of Yoga and Meditation ATMAN,
actually made up of MISA and its subsidiaries abroad.
Many of the conferences in the Congress have as their theme the idea that the practice of yoga is fully authenticated by science.
On the other hand, the "spiritual guide" of MISA does not MISS any opportunity to categorize scientists as "obtuse and skeptical",
while "yogis have known the discoveries of science for thousands of years", but they say that only AFTER the discoveries appear!
Instead, he promotes "scientific geniuses" like the swindler and international impostor Mehran Keshe (🔗 și 🔗).
On the list of speakers at the Congress,, along with simple yoga practitioners without pretensions of scientists,
there are also people who are academics.
One of them is D.B., who leads a group within MISA that studies global consciousness and its impact on the planetary environment 🔗.
There was once a project called the GCP Global Consciousness Project, which ran from 1998-2015 and undertook research using special machines.
Subsequently, the MISA group - with several such devices at their disposal - made measurements of "spiritual actions" at MISA,
which they present as evidence of the planetary impact of the "great school of yoga".
In all the laudatory presentations that MISA makes about itself, one cannot fail to mention "the August 2003 successful collaboration”
with Princeton University in the“ GCP Global Consciousness Project”, studying the connection between the collective psycho-mental
and events with a strong impact or, in other words, "disturbances in the Force".
"Science confirms the beneficial effects of the yogic yang spiral" (2 Oct 2005) 🔗:
"The GCP Global Planetary Consciousness Project uses state-of-the-art technology and precise methods to record and visualize effects
of events that can evoke a consciousness of the whole world.
A vast network of computers, spread around the world, including Romania, runs a special program that generates pseudo-random numbers.
Their order and frequency of occurrence are known: under normal conditions, the numbers generated follow a certain predictable curve.
However, when a phenomenon occurs with a very strong impact on very large groups of people (wars, natural disasters, etc.),
something is changing in the global energy environment, which will be reflected in the numbers generated "as randomly as possible" by that program.
Princeton scientists scientifically investigate yang spiral meditation performed by about 5,000 practitioners of the MISA yoga school
on August 28, 2003, the day the annual solar hiatus occurred.
Although the Romanian server that transmitted the recorded data to Princeton computers was over 700 km from the coast,
the results indicated very high values, a sign that the yogic meditation that took place on the day of the hiatus strongly influenced
the energetic ambiance.
Researchers in the Global Planetary Consciousness Project noted the similarity of the final diagram of spiral yogic meditation
with the graphic representation of the yin-yang symbol.
Although they have not yet provided an explanation, scientists have identified a key to building the diagram.
Its analysis from a fractal point of view shows the multitude of phenomena that took place in the 108 minutes of meditation placed in a spiral.
The mental waves emitted by the participants were coherent and unified.
Subtly-empathically connected, the Romanian yogis were in perfect group resonance, an aspect highlighted by the fact that
the various most important points of the diagram follow each other rhythmically and fractally.
The energetic effects of spiral meditation have been highlighted in several accurate diagrams and reports.
The yang energy emitted by the strings of people arranged in a spiral structured the mental energy.
Researchers in the CGP project found that the small fractal shapes highlighted in the graphs during the measurement
as well as the sequence of moments in the structure of the diagram are placed strictly according to the golden number, 16 (!!!).
The Princeton project attests to the value of MISA
A remarkable aspect of the graph showing the results recorded during the yogic yang spiral is the magnitude of the deviation
from the statistical average, much higher than in any other event monitored within the project.
This is a scientific attestation from MISA independent sources regarding the exceptional value of this yogic process.
The statistical curve has a sinusoidal shape. Immediately after the start of the spiral, a positive maximum was recorded,
followed by a zero crossing and then a negative maximum, and after the end of the spiral meditation the values were again within normal limits.
Princeton researchers believe that, statistically, the two sinusoidal loops compensate for each other, but they cannot give a plausible explanation
for the fact that the loops have a magnitude that breaks all records and they do not provide an interpretation
of the zero crossing of the statistical curve exactly at the time of the hiatus (2:43 Romanian time).
The results are verifiable, clear, objective, in perfect agreement with the avant-garde vision of frontier sciences.
Foreign scholars have solid evidence that MISA means a fresh and powerful spiritual breath.
The article "Foreign researchers set their sights on MISA - Yang spiral provokes the West" appeared in Yoga Magazine no. 51. "
Stupefaction, the GCP website says something completely different! The results of the August 28, 2003 spiral can be viewed here:
Mars Close Approach
A number of people suggested that the close approach of Mars late in August 2003 would be a good time for a GCP prediction.
On the 27th, our neighbor would be the closest in 60,000 years.
It refers to the big Yang spiral, which will take place in Costinesti, on the coast of the Black Sea, in the night of August 27/28.
The Yang spiral will last for 108 minutes, from UTC 23:00, August 27 to UTC 0:48, August 28, a.m. and will be attended
by 10,000 members of MISA from Romania and other countries.
MISA (the Spiritual Movement of Integration in the Absolute) is the largest yoga group in the world, having its main center in Bucharest
and additional centers in 20 Romanian cities.
It is conceived as a University; its members attend classes over every weekend, the overall duration of studies being of 13 years.
In the end, a dry comment:
The Yang spiral is associated with the annual astrological hiatus on UTC 23:43 August and with the closest approach of Mars to the Earth.
The formal prediction followed this prescription exactly, specifying the standard analysis.
The outcome, with 49 EGGS on the 27th and 50 on the 28th, is Chisquare is 6438.3 on 6480 df, and p = 0.641.
Thus the test statistic is slightly in the wrong direction, despite a strong positive trend at the beginning of the period.
That is all! Where are 5,000 of the 10,000 participants?
Where is the yin-yang diagram and unified fractals and coherent waves?
Where is the golden number (1,618 and not 16!)?
Where is the famous Princeton elite, raising the hossanas to the great yoga school?
It's nowhere, but in its place rises the mountains of lies from MISA.
In their purest tradition, MISA activists have once again tackled a completely parallel reality!
All the statements underlined from MISA statements above are outright lies, they were not stated by those from GCP!
It is also said that the "general duration of MISA courses is 13 years”.
By August 2003, the course had already reached 14 years of age and the beginning of the 15th year was approaching.
In other words, at the "university" MISA, there is also a "particular duration" of the course, which has already reached the year 33, without any sign of an end!
How many schools with endless courses have you heard of?
Next, a graph is shown that, if you really want to, you can imagine it as a sinusoid, in which the positive branch
it starts with a short drop below the baseline.
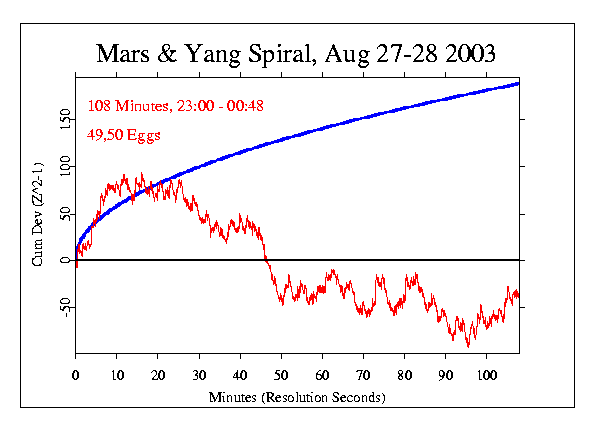
The so-called "fractal structure" is given by the alternation of increases and decreases, normal in random data sets,
in which the values oscillate above and below an average value.
But to those at MISA, who were necessarily looking for evidence in support of their ideas, the curve appears as a sinusoid made up in turn of small sinusoids,
so it has a fractal structure ("the part in the WHOLE and the WHOLE in the part"), therefore "the mental waves are coherent and unified",
"in perfect group resonance".
Of course, the "fractal analysis" (done with the eye!) is completely missing from the comments of the Princeton team.
The curve goes through zero at some point, but not at the exact moment of the maximum hiatus - 23:43 - but at the moment 23:46.
Actually, the discussion about the shape of the statistical curve is irrelevant, since it does not mean simply placing the data on the graph,
but it is the result of a statistical processing, which will be shown and explained at the end (the result came out exactly like the one from GCP!).
It is only necessary to say that on the vertical axis are placed cumulative values of the ”Z score” square minus one (Z^2 – 1),
so the "zero line" is actually ... the "value one line"!
This means that at the moment 23:47, the curve does not pass through the value "zero" but through the value "one" (z^2 - 1 = 0 so z^2 = 1)
and the value "one" is - as we will see later - the average value expected from the naturally occurring process.
So there is no question of the "vacuum state" (represented by the value "zero") manifested at the time of hiatus.
That's why the Princeton specialists didn't even have anything to explain with this crossing of the chosen baseline.
This is how the expected curve of a control test looks like (it is called the "drunkard walk" and it is obtained after running the test
when no apparent influence of the external environment is manifested and that the data are generated at random 🔗.
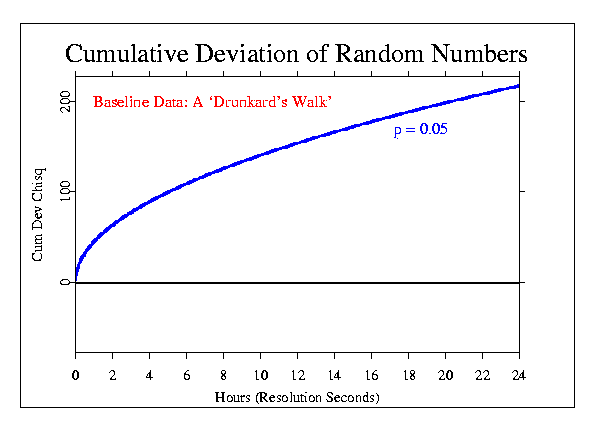
The random curve shows alternations of increase and decrease, as well as several passes through the baseline,
without these meaning that the surrounding energy environment goes through the neutral, vacuum state.
It is natural for such a curve to have ascents, descents and passages through the ground state.
In fact, these curves are statistical processing and do not simply place the data on the chart, as MISA believes.
It is observed that these natural data are below the BLUE LINE of 0.05, so all data between the line of 0.05 and the baseline
forms the so-called natural "white noise", which exists under normal conditions.
The ambiance is strongly influenced only when the data exceeds the blue line p = 0.05!
Here is a recording from January 28, 2011 from the ”Day of Rage” in Egypt, which also has the shape of a sinusoid 🔗.
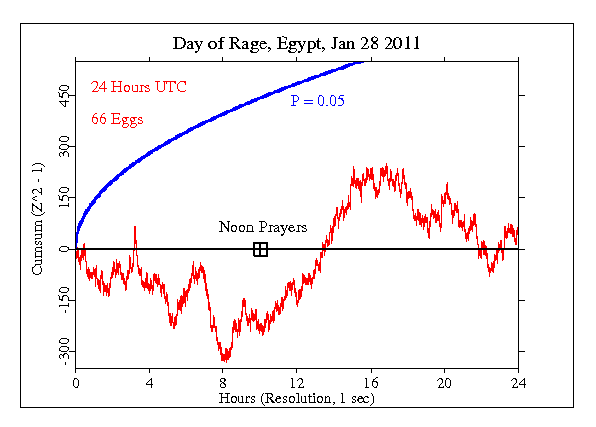
According to the MISA logic, the sinusoidal graph presented as great proof of the effects of hiatus meditation shows ... the rage of MISA!
GCP's statement that "statistics are slightly in the opposite direction, despite a strong positive trend since the beginning of the period",
is the nail in the coffin!
For the data to be significantly different from the natural background noise, it would have been necessary that most of the graph
to be located ABOVE the blue curve that corresponds to the value p = 0.05 and that is not put there for no reason!
As for the statement that "Princeton researchers cannot provide a plausible explanation for the fact that ”the data have a size that breaks all records",
you can easily see the lie by consulting the main page, where all experiments performed within the GCP are displayed.
The "Mars Close Approach" experiment is at position 149 since 27.08.2003 (timeframe 20030827), having a "Z score" of 0.623
which is neither the highest nor the lowest, and the probability p = 0.261 appears in light red (predicted direction),
while there are events in the "significant" category - marked in bright red, or "significantly in the opposite direction", marked in green.
In other words, the spiral is not something extraordinary, it is not significant and it falls into the "natural" category!
photo - HIATUS spiral
Instead, there are other events considered significant, such as the 9/11 attack, the Pope's visit to Israel, other spiritual events
or even peace meditations, which really have "a record-breaking magnitude"!
For example, a Valentine's Day meditation has a chi-square value of 87,606, a Z score of 2.89 and p = 0.002.
Almost all data is above the blue curve of 0.05.
There is a probability of 1-0.002 = 0.998 (99.8%) that the data will differ from the background noise!
The same goes for the Pope's visit to Israel.
photo - MISA SPIRAL vs other EVENTS
The Valentine's Day meditation 14.02.2009 appears among the events considered significant by the GCP, where the MISA spiral does not appear!
see the moment 34min:36sec from the presentation of the GCP project:
The MISA "study group" used similar devices in its own measurements.
The results obtained are presented in the conference "New and edifying studies on global consciousness" 🔗.
Their working hypothesis is that “strong deviations from statistical averages can show a huge collective field of beneficial consciousness
in the direction of harmonization and spiritualization of the entire planet", and their conclusion is that "the results of the MISA experiment
are already beginning to confirm the initial working hypotheses."
Starting with the 21min: 10sec moment of the conference on MisaTV, the team's results are displayed.
It is said that events were observed that did not respect the statistical curve called Gauss's "bell".
They even used two devices placed in different countries, obtaining the same results, thus suggesting that the effects of the studied meditations
extend over wide areas.
However, this does not exclude that those results are not determined by the group meditation, but by the global ambiance or conjuncture of that moment.
To distinguish the effects of meditations from the global ambience, meditations on the same theme are needed, repeated at different times
and then compared to the background measurement made before them.
Next, they discuss the August 2003 spiral, how its graph crosses the zero line at its maximum.
Then, on the contrary, several graphs from different actions are shown and it is insisted that these graphs have - throughout the measurement -
the tendency to move away from the starting line, which is interpreted in the sense that meditation determines
the appearance mainly only of one of the two possible states.
It would be like, by the power of the mind, the coin falls more on a certain face.
These experiments must comply with a basic law of scientific research - repeatability:
the same causes must produce the same effects.
In order to formulate a law, you must get the same results every time you reproduce the same cause.
If different effects result in the same cause, a general statement cannot be made, so a scientific law cannot be deduced.
“Insanity is doing the same thing over and over and expecting different results”, said Albert Einstein.
As of January 10, 2010, the following warning appears at the end of registrations on the GCP website:
”It is important to keep in mind that we have only a tiny statistical effect, so that it is always hard to distinguish signal from noise.
This means that every "success" might be largely driven by chance, and every "null" might include a real signal overwhelmed by noise.
In the long run, a real effect can be identified only by patiently accumulating replications of similar analyses.”
If single or very few measurements are made - as did those in MISA - one can always blame that the results are mere coincidences.
It is true that in the case of unexpected, unique and unrepeatable events, scientific research is not possible,
but it can be done in periodic events, such as annual meditations occasioned by astral conjunctures or given with significance.
It would also be necessary to repeat identical experiments, such as a meditation program with a specific theme - always the SAME -
at random dates and times, in which to get the same graphs!
Obviously, each experiment requires a set of reference data, more specifically a measurement of the ambience BEFORE the meditation begins
so that then, by comparison, the effects of the actual meditation can be highlighted.
The MISA team did not present any measurements of the solar hiatus in August of another year than the one in which GCP did it (2003).
Here are some of the graphs presented at the conference broadcast by MisaTV (grouped by numbered categories)
photo - MISA GRAPHS
1) The spirals of Brahmarandhra
They show systematic deviations in different directions.
After a start in which the data showed a significant deviation, the effect decreased and the curve returned between the blue lines.
The MISA team of "researchers" is constantly ignoring the blue curves, as their data is often below this line,
which shows a natural effect and not one produced by meditations.
2) Collective prayers
At the collective prayer in Bucharest from 12.08.2013, the effect is weak at the beginning, then it gradually increases and reaches the significance curve.
The same for the one in Bucharest from 14.06.2014.
However, if we compare this measurement in Bucharest (14.06.2014) with the one in Berlin made at the same time,
it is found that the Berlin effect no longer exceeds the level of significance.
And at the collective prayer on 22.11.2014 in Berlin, after a significant deviation from the beginning, the curve returns to the level of natural noise.
So even the collective prayer performed after an audio recording, having exactly the same development in time and exactly the same pattern,
gives different results from one moment to another and from one place to another!
3) Summer Solstice Spirals
In the 2014 meditations, measured simultaneously in Helsinki and Bucharest, the curves exceed the level significantly in the same range,
(between 1200 and 2000 on the horizontal axis), then they return to the natural noise pattern, the one in Bucharest being even weaker!
4) Collective invocations
Those of 5 and 12 July 2014 in Bucharest have deviations in the opposite direction from the collective prayers presented previously;
while the invocation of July 5th returns at some point below the level of significance, the one of July 12th gradually rises above this level.
5) Measurements from the spiritual actions within the Charismatic Movement (May 2, 2014, Herculaneum),
the meditations with Shambala (August 29, 2013), Faith in God (30.08.2013) and Divine Grace (2.01.2014) are all below the level of significance!
6) to note, however, the spiral of Communion with the Souls of the Nations (August 30, 2014) which gradually increases above the level of significance;
this is surprising because, being made after the hiatus spiral, most of the participants in the camp - especially those from abroad - were already gone,
the number of participants being very small!
7) even the curve measured in real time, during the conference posted on MisaTV, barely rises from zero,
proof of the "impact" and "interest" shown.
8) for comparison, a global meditation performed on 25.08.2013 by some "uninitiated" broke the level of significance after 2 minutes from the beginning!
Where are the patterns of spiritual action of MISA?
Annex. Effective statistical analysis and calculations for the 2003 hiatus spiral
GCP EXPERIMENT - EQUIPMENT AND PROTOCOL
The “Global Consciousness Project” GCP uses random event generators REG or random numbers generators RNG).
They use electronic noise generated by quantum processes, which are random events, without an apparent (spontaneous) cause
and therefore under normal conditions, their succession does not follow any pattern.
These quantum REGs should not be confused with other RANDOM devices, which generate pseudo-random numbers chosen by software.
REG quantum devices generate a so-called unpredictable white noise, which is picked up, amplified and transformed
in square signal (crenel), which contains random sequences of “0” and “1”.
It is the electronic equivalent of throwing coins (”heads or tails”).
The random generator is set to generate tests of 200 binary samples per second, which means 200 “0” or “1” per second.
The data is recorded by a computer.
Each computer, in turn, is connected to a global network, resulting in a kind of "planetary electroencephalogram" (EGG electrogram).
The data are then processed with mathematical methods of statistics, in order to assess the extent to which they correlate with external events.
In other words, we look for possible patterns in seemingly random events.
Here's how the software actually works: every second, the 200 states are generated and recorded which appear in the form
of a random sequence of "0" and "1".
Naturally, random data is grouped in the form of Gauss's "bell."

In the middle is the average value of the data; it is most likely to obtain a value close to the average.
For example: most often we will see people of normal, medium height, but very rarely dwarfs and giants.
Those whose height deviates far from the normal value, appear towards the extremities of the bell, after the line of 0.05!
1) First, the MEDIA of the 200 values is automatically calculated.
In spontaneous natural generation, there is no reason for any of the "0" or "1" values to be specifically generated;
therefore, they appear in random sequence but in equal numbers, 100 of each,
so their average is (100 * 0 + 100 * 1) / 200 = 0.5.
If the generator is influenced from the outside, the average value is no longer 0.5 (because "0" and "1" no longer appear in a balanced way),
but another value between 0 and 1 results.
For this reason, the shape of the bell changes, because its middle is closer to one of the ends!
2) Then we must analyze the DEVIATION of the data obtained from what should result naturally (noise).
The simple deviations - the differences between each value and the average - are not relevant because, being in both directions, both plus and minus,
deviations would compensate for each other when added together.
On the contrary, it is necessary for each deviation to count and, therefore, in order to avoid mutual annulment, each deviation is squared,
thus obtaining only positive numbers which are no longer canceled by addition; the resulting amount is divided by the number of data to be averaged;
then perform the inverse operation of squaring, extract the square root, obtaining the STANDARD DEVIATION (sigma),
which gives a general measure of the deviation of the data from the average.
In the natural generation of "0" and "1", each value deviates by plus or minus 0.5 (because their average 0.5 is in the middle).
So 200*(0.5*0.5)/200 = 0.25, and the radical gives 0.5. Therefore, in the case of natural generation, STANDARD DEVIATION = 0.5.
In the case of influencing the generator, another value is obviously obtained.
3) Then it is necessary to analyze how far EACH of the values obtained is from the average value.
Simply divide each simple deviation by the standard deviation, obtaining the STANDARD RESULT (Z-score).
Again, to avoid mutual cancellation, this is also squared, obtaining the STANDARD SQUARE RESULT (Z-square score).
At the natural generation of "0" and "1", for each value Z = 0.5 / 0.5 = 1, the square Z-score is obviously also 1,
and for all data collected in one second (200 generations), the total Z-score is 200.
Since the square Z-score is 1 for each value generated separately, the square Z-score minus 1 (Z^2 - 1) is used.
Thus, for each value generated, (Z^2 - 1) = 0, so the total gives zero. This is the ZERO LINE or the BASE LINE.
The software places on the graph the cumulative square Z-score for the 200 data generated in one second, then moves on to the next second and so on.
So the curve represents the statistical processing of the data and not the “0” or “1” data simply placed on the graph!
So the graph of the SQUARE STANDARD RESULT gives an idea about the distance of the data from the average, but it is not enough.
It is necessary to evaluate the TRUST LEVEL of this distance, because we saw that the shape of the bell changes with the accumulation of data,
because the middle of the bell - the average value - keeps changing with the generation of new data.
Significant deviation from the mean is considered to occur when the data are at the edges of the bell,
being spaced at least two STANDARD DEVIATIONS, more precisely the probability of differing significantly from the average
is at least 95%. (see the figure of the "bell").
Therefore, the software displays a blue curve, above and below the baseline, corresponding to the value of 0.05 (1-0.95 = 0.05).
The two "lecturers" always insist that the graphs deviate from the baseline, but this alone is not enough.
For the data to differ significantly from the white noise, it is not enough for the graph to deviate from the base axis,
but it must also go beyond the blue lines!
By the simple visual interpretation of the graphs, another kind of illusion appears, that the mental influence on the generators
manifests itself as soon as the meditations begin, causing the graphs to move away from the baseline.
First of all, the generator starts from the basic state that has Z^2 - 1 equal to zero, so it is normal to start from the origin.
Then, as independent data accumulates, the number of DF degrees of freedom increases and the level of significance changes.
It is therefore observed that the blue curves (significance level) also move away from the axis.
The average value of the data obtained also changes, which leads to a change in the shape of the "bell".
The fact that the graph deviates from the basic axis is therefore not relevant, as long as it is below the blue curves.
There is another contradiction in the statements at the conference:
on the one hand, in the case of all meditations except hiatus, the two insist on moving away from the basic axis;
on the other hand, in the case of the hiatus spiral, they insist that the graph, after it has moved away, then returns to the base and passes through zero!
It is true that the baseline represents the SQUARE STANDARD RESULT of the balanced generation (half "0", half "1"),
but this is the characteristic of the random state (perfect chaos) and not of the "state of the Creator Void"!
When the experiment is over, the software calculates the number of independent data obtained, also called the "number of degrees of freedom",
DF = degree of freedom); in this case, one every second.
As the spiral lasted 108 minutes, they are 108 x 60 = 6480 DF.
4) Then the software calculates the Chi-square value, more precisely the sum of the squares of the simple deviations divided by the average value.
Then the critical value of Chi-square and the significance level are calculated (an online computer can also be used).
For the MISA spiral, the GCP declared value of Chi-square is 6438.3, which leads to a critical Chi-square value of 6668.38.
Therefore, the value of p = 0.641. It is observed that the value of p is exactly the one presented on the GCP site.
photo - MISA results' STATISTIC
Since in the case of the spiral, Chi-square (6438.3) is less than the critical value (6668,38), then there is no significant difference
compared to the chaotically generated values with which the comparison is made!
The significance level of 0.641 is far above the required value 0.05, so no distinction can be made between data and noise!
THE NULL HYPOTHESIS is accepted (the data collected do not differ significantly from the usual noise), the alternative
(structuring the signals collected under the influence of meditation) is rejected!
A lot of ”white noise” for nothing!
We can now understand the GCP team's comment:
„The outcome is Chisquare is 6438.3 on 6480 df, and p = 0.641.
Thus the test statistic is slightly in the wrong direction, despite a strong positive trend at the beginning of the period.”
That is, although the Princeton team expected to notice a significant difference from natural noise,
the experiment evolved
in the opposite direction to the expectation and did not differ significantly from the noise, despite the promising start in the first quarter of hour.
Exactly the opposite of what MISA claims!
That's how long the MISA spiral lasted: a quarter of an hour, after which things returned back to "normal."
The question is: if the effects of the spiral would have been so extraordinary - as claimed by MISA -
why the measurement does not appear
in the GCP Project presentations and why it was not repeated by the GCP, as were the actions at Kumbha Mela or peace meditations?
PS. MISA published another set of data, in which the only relevant thing is that... there is no relevance! 🔗
photo - other MISA GRAPHS
No comments:
Post a Comment
tag form to add a photo:
[image width="400px" rel="nofollow" src="image_link"/]
do not go beyond a width of 400